Band leaders
Insights
Where the gigs and the money come from, and where they're heading. Great for planning next year.
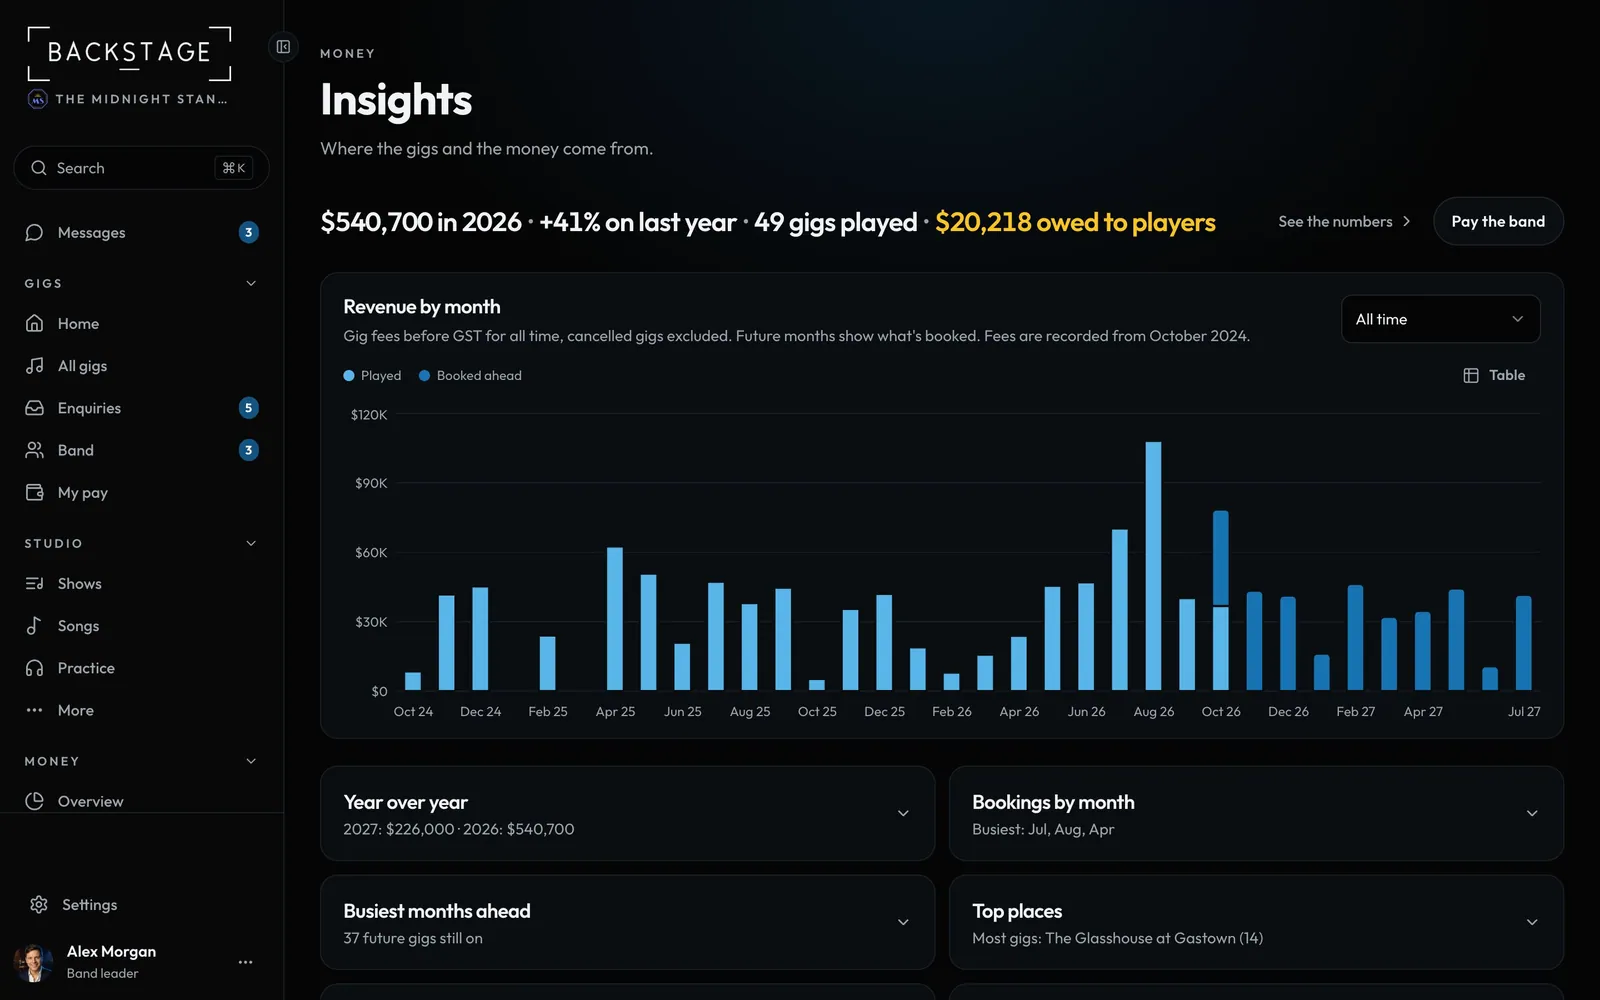
Swipe sideways to see the whole screen. Tap a number for its tip.
- This year in one lineRevenue, the change on last year, gigs played.
- Revenue by monthPlayed and booked ahead.
- Time rangeThis year, last year or all time.
- Every other chartOne row each. Tap to open it.
How to
- Open Insights in Money. The line at the top compares this year with last; See the numbers has the details.
- Pick a time range on Revenue by month.
- Tap a row to open its chart: year over year, busiest months, top venues, gig types, player earnings, most-played songs and lead conversion.
Tip
Tip
The Booking funnel row shows how many enquiries reach each stage in the last 90 days, and which sources actually book.